EconomicScenarioGenerators.jl


For single-model interest-rate scenario generation, prefer FinanceModels.ShortRate.{Vasicek, CoxIngersollRoss, HullWhite} together with FinanceModels.simulate/pv_mc (FinanceModels ≥ 6), which are the maintained successors of this package's generators. EconomicScenarioGenerators.jl remains the home of Correlated — copula-correlated simulation across multiple models — which FinanceModels does not provide. Bug fixes continue; new features land in FinanceModels.
Interested in developing economic scenario generators in Julia? Consider contributing to FinanceModels.jl. Open an issue, create a pull request, or discuss on the Julia Zulip's #actuary channel.
Usage
EconomicScenarioGenerators.jl is available via the General Registry. Install and use in the normal way:
- Add EconomicScenarioGenerators via Pkg
import EconomicScenarioGeneratorsorusing EconomicScenarioGeneratorsin your code
Examples
Importing packages
First, import both EconomicScenarioGenerators and FinanceModels:
using EconomicScenarioGenerators
using FinanceModels
Models
Interest Rate Models
VasicekCoxIngersollRossHullWhite
EquityModels
BlackScholesMerton
Interest Rate Model Examples
Vasicek
m = Vasicek(0.136,0.0168,0.0119,Continuous(0.01)) # a, b, σ, initial Rate
s = ScenarioGenerator(
        1,  # timestep
        30, # projection horizon
        m,  # model
    )
You can collect a single generated scenario like so:
rates = collect(s)And the package integrates with FinanceModels.jl:
YieldCurve(s)
will produce a yield curve object:
              ⠀⠀⠀⠀⠀⠀⠀⠀⠀⠀⠀Yield Curve (FinanceModels.Yield.Spline)⠀⠀⠀⠀⠀⠀⠀⠀⠀⠀⠀
              ┌────────────────────────────────────────────────────────────┐
         0.04 │⠀⠀⠀⠀⠀⠀⠀⠀⠀⠀⠀⠀⠀⠀⠀⠀⠀⠀⠀⠀⠀⠀⠀⠀⠀⠀⠀⠀⠀⠀⠀⠀⠀⠀⠀⠀⠀⠀⠀⠀⠀⠀⠀⠀⠀⠀⠀⠀⠀⠀⠀⠀⠀⠀⠀⠀⠀⠀⠀⠀│ Zero rates
              │⠀⠀⠀⠀⠀⠀⠀⠀⠀⠀⠀⠀⠀⠀⠀⠀⠀⠀⠀⠀⠀⠀⠀⠀⠀⠀⠀⠀⠀⠀⠀⠀⠀⠀⠀⠀⠀⠀⠀⠀⠀⠀⠀⠀⠀⠀⠀⠀⠀⠀⠀⠀⠀⠀⠀⠀⠀⠀⠀⠀│
              │⠀⠀⠀⠀⠀⠀⠀⠀⡀⠀⠀⠀⠀⠀⠀⠀⠀⠀⠀⠀⠀⠀⠀⠀⠀⠀⠀⠀⠀⠀⠀⠀⠀⠀⠀⠀⠀⠀⠀⠀⠀⠀⠀⠀⠀⠀⠀⠀⠀⠀⠀⠀⠀⠀⠀⠀⠀⠀⠀⠀│
              │⠀⠀⠀⠀⠀⠀⡠⠎⠉⠉⠊⠉⠑⠦⠤⠤⣄⡀⠀⠀⠀⠀⠀⠀⠀⠀⠀⠀⠀⠀⠀⠀⠀⠀⠀⠀⠀⠀⠀⠀⠀⠀⠀⠀⠀⠀⠀⠀⠀⠀⠀⠀⠀⠀⣀⣀⡠⠤⠤⠔│
              │⠀⠀⠀⠀⢀⠖⠁⠀⠀⠀⠀⠀⠀⠀⠀⠀⠀⠉⠑⠦⢄⣀⠀⠀⠀⠀⠀⠀⠀⠀⠀⠀⠀⠀⠀⠀⠀⠀⠀⠀⠀⠀⠀⠀⢀⣀⣀⣀⠤⠔⠒⠊⠉⠉⠀⠀⠀⠀⠀⠀│
              │⠀⠀⠀⢰⠃⠀⠀⠀⠀⠀⠀⠀⠀⠀⠀⠀⠀⠀⠀⠀⠀⠀⠉⠓⠒⠦⠤⢄⣀⠀⠀⠀⠀⠀⠀⠀⠀⣀⣀⠤⠔⠒⠉⠉⠁⠀⠀⠀⠀⠀⠀⠀⠀⠀⠀⠀⠀⠀⠀⠀│
              │⠀⠀⠀⡎⠀⠀⠀⠀⠀⠀⠀⠀⠀⠀⠀⠀⠀⠀⠀⠀⠀⠀⠀⠀⠀⠀⠀⠀⠀⠉⠒⠒⠒⠒⠊⠉⠉⠁⠀⠀⠀⠀⠀⠀⠀⠀⠀⠀⠀⠀⠀⠀⠀⠀⠀⠀⠀⠀⠀⠀│
   Continuous │⠀⠀⢰⠁⠀⠀⠀⠀⠀⠀⠀⠀⠀⠀⠀⠀⠀⠀⠀⠀⠀⠀⠀⠀⠀⠀⠀⠀⠀⠀⠀⠀⠀⠀⠀⠀⠀⠀⠀⠀⠀⠀⠀⠀⠀⠀⠀⠀⠀⠀⠀⠀⠀⠀⠀⠀⠀⠀⠀⠀│
              │⠀⠀⡇⠀⠀⠀⠀⠀⠀⠀⠀⠀⠀⠀⠀⠀⠀⠀⠀⠀⠀⠀⠀⠀⠀⠀⠀⠀⠀⠀⠀⠀⠀⠀⠀⠀⠀⠀⠀⠀⠀⠀⠀⠀⠀⠀⠀⠀⠀⠀⠀⠀⠀⠀⠀⠀⠀⠀⠀⠀│
              │⠀⡸⠁⠀⠀⠀⠀⠀⠀⠀⠀⠀⠀⠀⠀⠀⠀⠀⠀⠀⠀⠀⠀⠀⠀⠀⠀⠀⠀⠀⠀⠀⠀⠀⠀⠀⠀⠀⠀⠀⠀⠀⠀⠀⠀⠀⠀⠀⠀⠀⠀⠀⠀⠀⠀⠀⠀⠀⠀⠀│
              │⢀⡇⠀⠀⠀⠀⠀⠀⠀⠀⠀⠀⠀⠀⠀⠀⠀⠀⠀⠀⠀⠀⠀⠀⠀⠀⠀⠀⠀⠀⠀⠀⠀⠀⠀⠀⠀⠀⠀⠀⠀⠀⠀⠀⠀⠀⠀⠀⠀⠀⠀⠀⠀⠀⠀⠀⠀⠀⠀⠀│
              │⡸⠀⠀⠀⠀⠀⠀⠀⠀⠀⠀⠀⠀⠀⠀⠀⠀⠀⠀⠀⠀⠀⠀⠀⠀⠀⠀⠀⠀⠀⠀⠀⠀⠀⠀⠀⠀⠀⠀⠀⠀⠀⠀⠀⠀⠀⠀⠀⠀⠀⠀⠀⠀⠀⠀⠀⠀⠀⠀⠀│
              │⠉⠉⠉⠉⠉⠉⠉⠉⠉⠉⠉⠉⠉⠉⠉⠉⠉⠉⠉⠉⠉⠉⠉⠉⠉⠉⠉⠉⠉⠉⠉⠉⠉⠉⠉⠉⠉⠉⠉⠉⠉⠉⠉⠉⠉⠉⠉⠉⠉⠉⠉⠉⠉⠉⠉⠉⠉⠉⠉⠉│
              │⠀⠀⠀⠀⠀⠀⠀⠀⠀⠀⠀⠀⠀⠀⠀⠀⠀⠀⠀⠀⠀⠀⠀⠀⠀⠀⠀⠀⠀⠀⠀⠀⠀⠀⠀⠀⠀⠀⠀⠀⠀⠀⠀⠀⠀⠀⠀⠀⠀⠀⠀⠀⠀⠀⠀⠀⠀⠀⠀⠀│
        -0.01 │⠀⠀⠀⠀⠀⠀⠀⠀⠀⠀⠀⠀⠀⠀⠀⠀⠀⠀⠀⠀⠀⠀⠀⠀⠀⠀⠀⠀⠀⠀⠀⠀⠀⠀⠀⠀⠀⠀⠀⠀⠀⠀⠀⠀⠀⠀⠀⠀⠀⠀⠀⠀⠀⠀⠀⠀⠀⠀⠀⠀│
              └────────────────────────────────────────────────────────────┘
              ⠀0⠀⠀⠀⠀⠀⠀⠀⠀⠀⠀⠀⠀⠀⠀⠀⠀⠀⠀⠀⠀⠀⠀⠀⠀⠀⠀time⠀⠀⠀⠀⠀⠀⠀⠀⠀⠀⠀⠀⠀⠀⠀⠀⠀⠀⠀⠀⠀⠀⠀⠀⠀⠀⠀30⠀
CoxIngersollRoss
A CIR model:
m = CoxIngersollRoss(0.136,0.0168,0.0119,Continuous(0.01))Hull White Model using a FinanceModels.jl yield curve
Construct a yield curve and use that as the arbitrage-free forward curve within the Hull-White model.
using FinanceModels, EconomicScenarioGenerators
rates =[0.01, 0.01, 0.03, 0.05, 0.07, 0.16, 0.35, 0.92, 1.40, 1.74, 2.31, 2.41] ./ 100
mats = [1/12, 2/12, 3/12, 6/12, 1, 2, 3, 5, 7, 10, 20, 30]


curve = FinanceModels.fit(
    Spline.Cubic(),
    CMTYield.(rates,mats),
    Fit.Bootstrap()
)


m = HullWhite(.1,.002,curve) # a, σ, curve

s = ScenarioGenerator(
        1/12,  # timestep
        30., # projection horizon
        m,  # model
    )
Create 1000 yield curves from the scenario generator:
n = 1000
curves = [YieldCurve(s) for i in 1:n]
Plot the result:
using Plots

times = 1:30
p=plot(title="EconomicScenarioGenerators.jl Hull White Model")

# plot the zero rates
for d in curves
    plot!(p,times,rate.(zero.(d,times)),alpha=0.2,label="")
end

plot!(times,rate.(zero.(curve,times)),line=(:black, 5), label="Given Yield Curve")
p

Equity Model Examples
BlackScholesMerton
m = BlackScholesMerton(0.01,0.02,.15,100.)

s = ScenarioGenerator(
               1,  # timestep
               30, # projection horizon
               m,  # model
           )
Instantiate an array of the projection with collect(s).
Plotted BSM Example
Plot 100 paths:
using Plots
projections = [collect(s) for _ in 1:100]

p = plot()

for p in projections
    plot!(0:30,p,label="",alpha=0.5)
end

p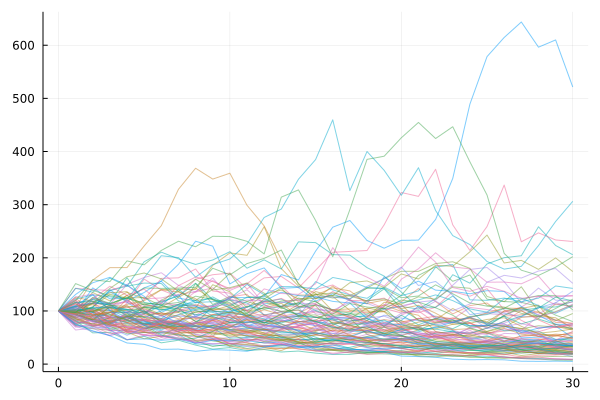
Correlated Scenarios
Combined with using Copulas, you can create correlated scenarios with a given copula. See ?Correlated for the docstring on creating a correlated set of scenario generators.
Example
Create two equity paths that are 90% correlated:
using EconomicScenarioGenerators, Copulas

m = BlackScholesMerton(0.01,0.02,.15,100.)
s = ScenarioGenerator(
                      1,  # timestep
                      30, # projection horizon
                      m,  # model
                  )

ss = [s,s] # these don't have to be the exact same, but do need same shape
g = ClaytonCopula(2,7) # highly dependent model
c = Correlated(ss,g)

x = collect(c) # an array of tuples

using Plots

# get the 1st/2nd value from the scenario points
plot(getindex.(x,1))
plot!(getindex.(x,2))
Other ESG packages
- Python
- https://github.com/jason-ash/pyesg